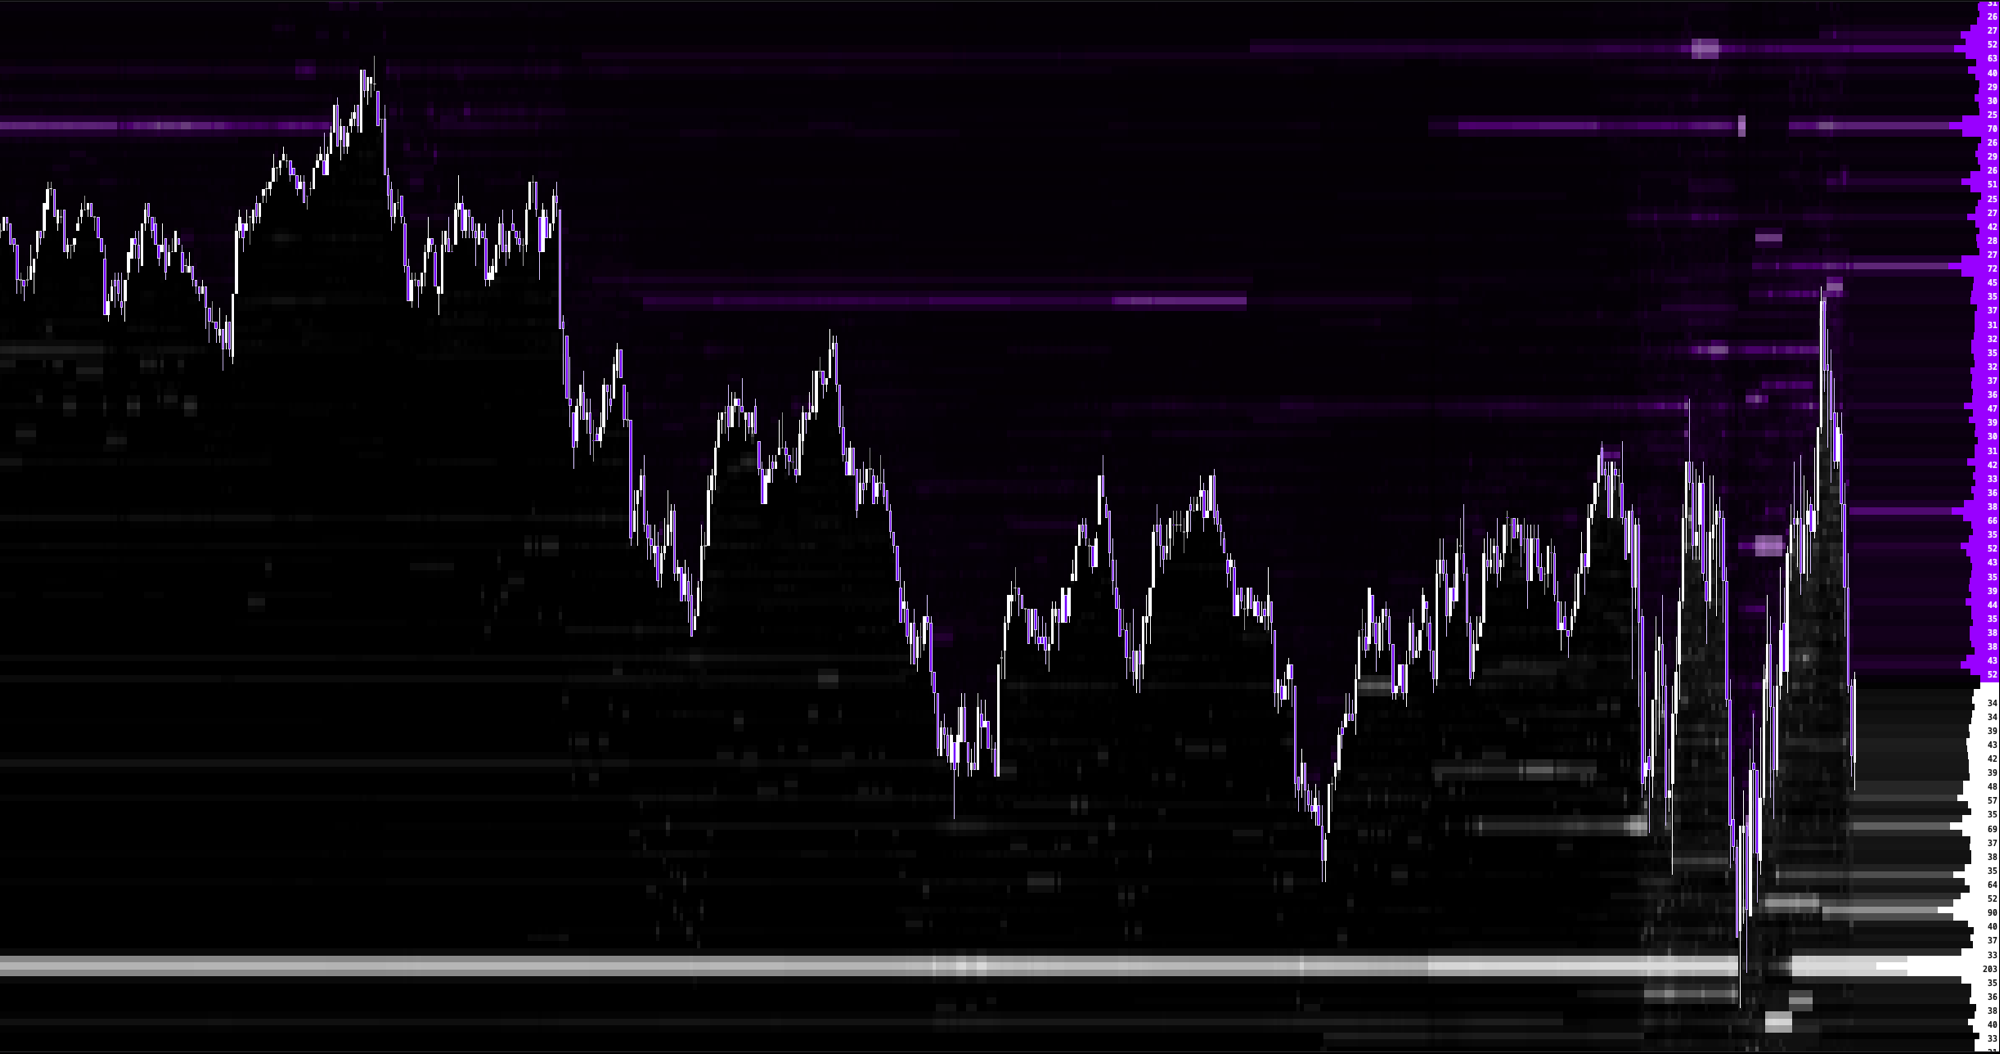
Swing lines and session markers
Straight lines between points: connect each new swing high to the previous one and each new swing low to the previous one, draw a vertical line at every cash session open, and project the latest swing line to the right edge.
//@xfscript 1
indicator("Swing Lines")

let length: int = input.int(20, "length", "Swing length", 3, 200, 1)
let high_color: color = input.color("#EF4444", "highColor", "Swing highs")
let low_color: color = input.color("#22C55E", "lowColor", "Swing lows")

let ready: bool = bar_index >= length
let new_high: bool = ready && high >= ta.highest(high, length) && high > nz(high[1], high)
let new_low: bool = ready && low <= ta.lowest(low, length) && low < nz(low[1], low)

var high_bar: float = nan
var high_price: float = nan
var low_bar: float = nan
var low_price: float = nan
high_bar := nz(high_bar[1], nan)
high_price := nz(high_price[1], nan)
low_bar := nz(low_bar[1], nan)
low_price := nz(low_price[1], nan)

plot.segment(new_high && !is_nan(high_bar), high_bar, high_price, bar_index, high, high_color, 2, "solid")
plot.segment(new_low && !is_nan(low_bar), low_bar, low_price, bar_index, low, low_color, 2, "solid")
if new_high {
  high_bar := bar_index
  high_price := high
}
if new_low {
  low_bar := bar_index
  low_price := low
}

let in_cash: bool = session.in("0930-1600", "America/New_York")
let cash_open: bool = in_cash && !(bar_index > 0 && in_cash[1])
plot.vline(cash_open, "#6B7280", 1, "dotted")
plot.hline(high_price, high_color, 1, "dotted", "Last swing high")
plot.hline(low_price, low_color, 1, "dotted", "Last swing low")